 This is the third entry in the interpreting research series. The first entry focused on the anatomy of a research article (https://rsetasc.pnwboces.org/anatomy-research-study-interpreting-research-blog-1/) and the second on research design (https://rsetasc.pnwboces.org/interpreting-research-volume-2-types-research-studies-experimental-design/). This article focuses on effect sizes and their importance.
[WARNING: There is some discussion in this entry about statistics! But very little, I promise, and I will use non-statistical terms to explain them.]
Effect sizes are most often reported in meta-analyses although the American Psychological Association (APA) has been calling on researchers to report effect sizes in every study since 1994 (Wilkinson et.al. 1994). However, when you come across a mention of effect sizes, sometimes given as d or g, do you do what many educators and readers do and skip right past that section to the discussion and conclusion, hoping those sections will explain the meaning of the statistical jargon? Let’s see if I can help you understand exactly what an effect size is so that next time you can delve into the stats section.
Effect size is actually not that difficult to understand once you get over your fear of statistics. Effect size is a measure of the impact an intervention or practice had, or the “magnitude of the difference between groups” (Sullivan and Fine 2012). Effect sizes are calculated by the following formula:
Mean of experimental group – mean of control group
Standard Deviation
This actually isn’t all that important, but its good background knowledge to have if you are curious.
Here’s the important stuff: how do you read and interpret an effect size?
Effect sizes are reported in decimal form, e.g., d=.3 or d=1.6. These numbers represent how many standard deviations a person in the expe rimental group is above an average person in the control group. What does that mean? Let’s take d=.3 for example. This means that if we took the average person in the experimental group (Bob) and compared him to the average person in the control group (Mike), Bob would be .3 standard deviations above Mike on the post-test. Hmm, you’re wondering, how significant is that?
Well let’s take Mike and Bob and imagine they are in two different classes of 25 students. If you rank ordered them on their performance in their classes, they are both number 13, or right in the middle of their respective classes. Mike’s class does not receive an intervention and Bob’s class does. After the intervention they take a post-test, where would Bob rank in his own class? Still number 13, because the rest of his class also received the intervention, so they all moved, or didn’t move, at presumably the same rate. But what if we moved Bob to Mike’s class? If the effect size for that particular intervention were 0, meaning 0 standard deviations of movement, Bob would be equal with Mike, i.e., he would not have moved at all. If the standard deviation were d=.3 like in our example above, Bob would now rank 10th in Mike’s class, just because he received the intervention and the students in Mike’s class didn’t. When the effect size reaches d=1.6 Bob would place first in Mike’s class.
As you can see, the larger the effect size the better. This doesn’t mean that we always need huge effect sizes for an intervention or practice to be considered effective. A standard rule of thumb in education research is that an effect size of .2 or below is small, .3-.8 is medium, and .8 or above is large. As readers we really want to see effect sizes of .3 or more.
As you read research you will see many statistical measures reported, all of which tell us a lot about the effectiveness of the given practice or intervention. Effect sizes tell us how effective a practice is and help us determine if we should try the practice or intervention for ourselves. For more information on this see my video on the topic (https://www.youtube.com/watch?v=6uYNVCy-8NA&feature=youtu.be) and go to this article on effect sizes, which has a really great chart breaking the effect sizes down.
 Data-Driven Decision-Making
  Increasing Post-School Success through Interagency Collaboration
  How Can We Improve Deeper Learning for Students with Disabilities?
  Positive Classroom Management: Creating an Environment for Learning
  Self-Determination Skills Empower Students of All Ages
  Fidelity of Implementation: What is it and Why does it Matter?
  Rethinking Classroom Assessment
  A Three-Step Approach to Identifying Developmentally Appropriate Practices
 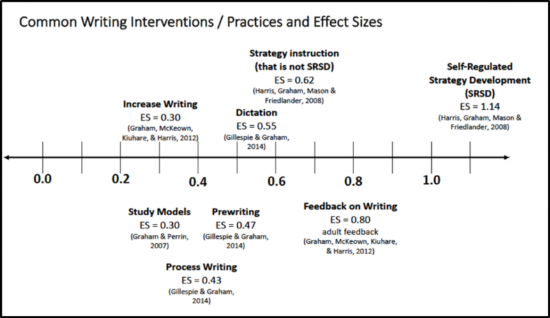 Transforming Evidence-Based Practices into Usable Innovations: A Case Study with SRSD